
 US

AI Predictive Maintenance: How Edge AI and IoT Predict Machine Failures
AI predictive maintenance uses sensor data and machine learning to forecast machine faults before they stop production. Here is how it works from sensor to work order: the signals, the edge and cloud split, model types, integration and the hardware to run it.
AI predictive maintenance is the use of machine learning on live sensor and process data to detect developing faults in machines and forecast when they will need attention, so repairs are planned before a breakdown stops production. It combines industrial IoT, which measures and moves the data, with AI models that learn how each machine normally behaves and flag the changes that come before a failure.
The idea behind predictive maintenance is older than the technology: most mechanical faults develop gradually, and a machine gives warning signs weeks before it fails. Condition monitoring has measured those signs for decades. What has changed is the cost of sensors, connectivity and computing. A small fanless computer beside the machine can now process vibration data continuously, and a model trained on that data can spot patterns no fixed alarm limit would catch.
This guide is the implementation view. It follows the data from the sensor to the work order: which signals to measure, what runs on edge AI hardware at the machine and what runs in the cloud, which model types suit which problems, how the system connects to PLCs, historians and maintenance software, and how to size the hardware. For the basics of the maintenance strategy itself, start with our explainers on predictive maintenance and condition monitoring.
Key takeaways
- 01Learn normal, flag the change
- Most AI predictive maintenance starts with anomaly detection: a model learns each machine’s healthy behavior and flags drift, so it does not need years of failure records.
- 02Vibration leads, but not alone
- Vibration, temperature and motor current cover most rotating machines; acoustic, oil and process data from the PLC fill the gaps.
- 03Edge for signals, cloud for fleets
- High-rate signals are reduced to features at the machine; the cloud compares machines, retrains models and keeps the history.
- 04Integration decides the outcome
- A prediction only saves money when it reaches the maintenance team as a work order, so connect to the PLC, historian and CMMS from the start.
- 05Start small and measure
- Pilot on a few critical assets, record downtime and maintenance cost before and after, then scale what works.
How AI predictive maintenance works
Every system, from one pump to a whole plant, follows the same five steps. The AI sits in the middle; the steps either side decide whether it is useful.
-
Sense
Sensors and PLC tagsAccelerometers, temperature probes, current transformers and acoustic sensors measure the machine’s condition. Process values the PLC already holds, such as speed, load and pressure, add context.
-
Collect
I/O and gatewayData acquisition modules digitize the analog signals, and an IIoT gateway reads PLCs over Modbus, OPC UA or the plant’s fieldbus. Every value is timestamped against one clock.
-
Infer
Edge AI at the machineAn edge computer turns raw waveforms into features such as RMS, peak and spectral bands, then runs the model. Only features, scores and alerts leave the cabinet.
-
Predict
Fleet modelsCentral systems compare similar machines, trend health scores, estimate remaining useful life and retrain the edge models as more data and confirmed faults arrive.
-
Act
Work ordersAlerts become work orders in the maintenance system with the evidence attached, and technicians record what they find, which feeds the next round of training.
The processing chain behind a prediction
The steps above map onto a reference model that maintenance engineers already use. ISO 13374, the standard for condition monitoring data processing, splits the work into six blocks. Thinking in these blocks helps decide what runs where and what each piece of software is responsible for.
| Block | What it does | Typical location |
|---|---|---|
| Data acquisition | Samples sensors and reads controller tags, with timestamps | Sensor, I/O module, gateway |
| Data manipulation | Filters, windows and converts raw signals into features such as RMS, kurtosis and FFT bands | Edge computer |
| State detection | Compares features with a baseline or limit and flags abnormal behavior | Edge computer |
| Health assessment | Diagnoses the likely fault, such as bearing wear, misalignment or cavitation | Edge or central |
| Prognostic assessment | Estimates how long until the fault becomes critical (remaining useful life) | Usually central |
| Advisory generation | Recommends an action and raises the work order | Central, linked to the CMMS |
AI changes the middle blocks most. Fixed alarm limits are replaced or supported by models that learn the baseline for each machine and each operating condition, and by prognostic models that turn a trend into a date. The first block and the last are still engineering and integration work, and that is where most projects succeed or stall.
Sensors and signals for predictive maintenance
No single measurement catches every fault, so the choice of sensors starts from the failure modes you want to catch. The table lists the common signals, what each one reveals and how much data it produces, which matters later when sizing the edge hardware.
| Signal | What it reveals | Typical sensor | Typical sample rate | Data load |
|---|---|---|---|---|
| Vibration | Imbalance, misalignment, looseness, bearing and gear wear | Piezoelectric or MEMS accelerometer | Several kHz to tens of kHz per channel | High: process at the edge |
| Temperature | Friction, overload, lubrication and cooling faults, poor electrical connections | RTD, thermocouple, thermistor | About once a second or slower | Low |
| Motor current | Rotor bar faults, load changes, some bearing and supply faults | Current transformer or clamp sensor | kHz range for signature analysis; slower for load trends | Medium to high |
| Acoustic and ultrasound | Early bearing damage, leaks, arcing and partial discharge | Contact ultrasound or acoustic emission sensor, microphone | Ultrasonic range, above 20 kHz | High: process at the edge |
| Oil condition | Wear metals, water and contamination in gearboxes and hydraulics | Inline particle, moisture or viscosity sensor; lab sample | Minutes to hours; lab samples weekly or monthly | Low |
| Pressure and flow | Pump wear, blockages, cavitation, leaks | 4–20 mA transmitter | Sub-second to seconds | Low |
| Process data | Speed, load, set points, cycle counts and alarms that explain the readings | PLC or drive tags | 100 ms to seconds | Low |
| Thermal and visual images | Hot spots in panels and motors, leaks, belt and wear damage | Thermal or visible camera | Periodic images or video streams | High: inference at the edge |
Most sensors deliver analog signals as a voltage, a current or an IEPE accelerometer signal, so they need conditioning and conversion before a computer can use them. Analog I/O modules and dedicated vibration acquisition hardware handle that step; our range of data acquisition and I/O modules covers the general-purpose side. Wireless vibration and temperature sensors are often the quickest way to retrofit older machines, at the cost of lower sample rates and battery changes.
Process data is easy to overlook. A vibration reading that doubles may be a developing fault, or simply the machine running at a higher speed. Models that see load and speed alongside the condition signals raise far fewer false alarms, which is why the gateway that reads the PLC is as important as the sensors.
Edge vs cloud: where each job runs
Predictive maintenance is rarely all edge or all cloud. The split follows the data: high-rate signals are processed close to the machine, and anything that needs many machines or long history runs centrally. Our explainer on edge AI vs cloud AI covers the general trade-offs; the table shows how they apply here.
| Job | At the edge | In the cloud or data centre |
|---|---|---|
| Signal processing | Filtering, windowing, FFT and feature extraction on raw waveforms | Rarely; raw waveforms are sent only for diagnosis |
| Anomaly detection | Per-machine models scoring every window in real time | Fleet-wide comparison of similar machines |
| Fault diagnosis | Known fault signatures, such as bearing defect frequencies | Expert review and new fault classes |
| Remaining useful life | Simple trend extrapolation | Prognostic models using fleet and failure history |
| Model training | Occasional fine-tuning or baseline updates | Main training and validation |
| Storage | A buffer of features and recent raw data | Long-term history in a historian or data lake |
| Response time | Milliseconds to seconds, and keeps working if the link drops | Seconds to minutes, depends on the connection |
Why the edge does the signal processing
A worked example shows why. One accelerometer channel sampled at 25.6 kHz with 16-bit resolution produces about 51 kB a second, or about 4.4 GB a day. A motor with three axes on two bearings multiplies that by six. Sending it all to the cloud is expensive and rarely useful, because a model needs only a few dozen features per window.
Reduce each one-second window to 10 features at 4 bytes each and the same channel sends about 3.5 MB a day, roughly a thousandth of the raw data. The edge computer keeps the last few minutes of raw waveform in a buffer, so when a model flags an anomaly it can send that recording for an engineer to look at. This pattern also keeps the system working through network outages and keeps raw production data on site, which matters to many operators.
Model types: from thresholds to remaining useful life
“AI” covers a wide range of methods in predictive maintenance. Most mature programs use several of them side by side, and the right starting point depends mainly on how much labeled failure data you have.
| Approach | How it works | Data needed | Strengths | Limits |
|---|---|---|---|---|
| Fixed limits | Alarm when a value passes a set level, often from ISO 20816 vibration severity zones | None beyond the limit | Simple, explainable, standard | Late warnings; one limit for all operating conditions |
| Statistical trending | Tracks a feature over time and alerts on rate of change | Weeks of normal data | Earlier than fixed limits; cheap to run | Struggles with variable speed and load |
| Anomaly detection | Learns normal behavior across many features and scores how unusual each window is (isolation forest, autoencoder, one-class models) | Normal operation only | No failure history needed; catches unknown faults | Says something is wrong, not what |
| Fault classification | Supervised model that names the fault from features or spectra, sometimes a convolutional network | Labeled examples of each fault | Specific diagnosis | Needs confirmed fault cases, which are rare |
| Remaining useful life | Regression or degradation models that estimate time to a failure threshold | Run-to-failure or degradation histories | Turns a trend into a planning date | Needs the most data; wide uncertainty |
| Physics-informed or digital twin | Combines an engineering model of the machine with measured data | Design data plus measurements | Works with little failure data; explainable | Engineering effort per machine type |
Why most projects start with anomaly detection
Well-maintained machines rarely fail, so there are few examples of each failure to learn from. Anomaly detection sidesteps that problem by learning only what healthy looks like. Once it is running, every alert a technician investigates becomes a labeled example, and over time those labels make fault classification and remaining useful life estimates possible. A digital twin of the asset can help in the early months by showing what a reading should be at a given speed and load.
Running models on edge hardware
Most predictive maintenance models are small. A feature-based anomaly model runs comfortably on the processor of an industrial gateway. Models that work on full spectra or spectrogram images, often a convolutional neural network, benefit from a neural processing unit or GPU, and vision-based inspection needs one. Models are usually trained centrally and converted for the edge, separating training and inference; INT8 quantisation and toolchains such as TensorRT for Jetson or OpenVINO for Intel processors cut the computing they need. Accelerator performance is quoted in TOPS, but for signal models the processor, memory and I/O usually matter as much.
Data and integration: OPC UA, MQTT, Modbus and historians
A prediction is only worth something when it reaches the people who can act on it. That means the system has to read data from the machines and controllers already on site, and write its results into the tools the maintenance team already uses.
| Protocol or system | Role in predictive maintenance | Typical use |
|---|---|---|
| Modbus RTU and Modbus TCP | Reads registers from PLCs, drives, meters and remote I/O | Older and simpler equipment; serial RS-485 or Ethernet |
| OPC UA (IEC 62541) | Structured, secure access to controller and machine data with built-in information models | Modern PLCs, machine builders, plant-wide data |
| MQTT, often with Sparkplug B | Lightweight publish and subscribe messaging from edge to broker | Sending features, health scores and alerts to central systems |
| EtherNet/IP, PROFINET | Plant fieldbuses that carry controller data | Usually read through the PLC or a protocol gateway |
| Historian or time-series database | Stores readings, features and scores with timestamps | Trend analysis, model training, audit trail |
| CMMS or EAM | Maintenance management software that holds assets and work orders | Turning alerts into planned jobs and recording what was found |
In practice an IIoT gateway or edge computer sits in the control cabinet, reads the PLC over Modbus or OPC UA, reads its own sensors through I/O modules, and publishes results over MQTT. Our explainer on Modbus RTU and Modbus TCP covers the older serial and Ethernet variants, and RS-485 remains common on drives and meters.
Three details cause more trouble than the models. Time synchronisation: features from different devices must share one clock, ideally via NTP or PTP. Context: every reading needs the asset, the operating state and the measurement units attached, or a model cannot compare like with like. Security: the system bridges operational and IT networks, so it should be segmented, use encrypted protocols and have a clear update process. We configure the operating system, protocol software and remote access on every system we supply, so it arrives ready to connect to your network.
Hardware for AI predictive maintenance
Each layer of the system has a hardware category of its own, from the I/O that digitises a sensor to the computer that runs the model.
Data acquisition and I/O
Analog, digital, serial and CAN modules that turn sensor signals into data a computer can process.
View range
Industrial IoT gateways
Low-power fanless gateways that read PLCs and meters, run rules and lightweight models, and publish results.
View range
DIN rail PCs
Computers that clip onto the rail inside the control cabinet, next to the PLC and power supplies.
View range
NVIDIA Jetson
GPU-accelerated modules for multi-channel signal models and camera-based inspection at the machine.
View range
Hailo AI accelerators
Low-power M.2 accelerators that add neural network inference to an x86 or Arm computer.
View range
Fanless PCs
Sealed, fanless computers with no moving parts for dusty, hot and vibrating plant areas.
View rangeMatching the hardware to the workload
The right computer depends on how much signal processing and inference each site needs. Most deployments fall into one of four patterns. All of the examples below are fanless, which removes the dust and fan wear that would otherwise make the monitoring hardware a maintenance item of its own.
| Workload | Typical hardware | Example from our range | Why it fits |
|---|---|---|---|
| Collect PLC data, run rules and simple trends | Industrial IoT gateway | ASRock Industrial iEP-5000G | Intel Atom x6425RE, three RS-232/422/485 ports, 4 DI/4 DO, TSN support under Linux, −40 to 70 °C |
| Vibration features and anomaly models on several machines | DIN rail PC with NPU, optional accelerator | SolidRun BEDROCK R8000 | AMD Ryzen Embedded 8000 with a 16 TOPS NPU, M.2 slots for Hailo-8 or Hailo-10, 4× 2.5GbE, −40 to 85 °C builds |
| Many channels plus camera inspection in the cabinet | Jetson DIN rail computer | Diamond Systems JETBOX-JACKSON | Jetson Orin NX up to 100 TOPS, CAN, 16 GPIO, −25 to 80 °C fanless |
| Compact AI at the machine with isolated field I/O | Jetson DIN rail box PC | Winmate NTDRW100 | Jetson Orin Nano 8GB up to 67 TOPS, CAN FD, isolated serial and 8 DI/8 DO, 9–36 V DC |
| Vision inspection alongside an x86 application | Fanless PC with Hailo-8 | Vecow ECX-3000 AI | Core i9-13900E with Hailo-8 at up to 26 TOPS, 2.5GbE with TSN, four COM ports |
Beyond processing power, check the details that decide whether the computer survives the cabinet: the operating temperature range at your worst-case ambient, a wide DC input that matches the cabinet supply, isolated I/O where it connects to field wiring, and a way to manage the system remotely, such as out-of-band management. Our guides to DIO vs GPIO and GPU vs NPU go further on I/O and accelerators, and our IoT edge gateway case study shows fanless gateways relaying machine data to a predictive maintenance service.
For larger sites, the wider ranges of edge AI computers and industrial IoT gateways cover more processor and I/O combinations, and our article on rugged edge computers for AIoT looks at the environmental side. Every system is configured with the operating system, drivers and your software image, then tested before it ships.
Edge computers for predictive maintenance
Four starting points from the table above: an extended-temperature IIoT gateway, an AMD Ryzen DIN rail PC with NPU and Hailo options, and two NVIDIA Jetson DIN rail computers.
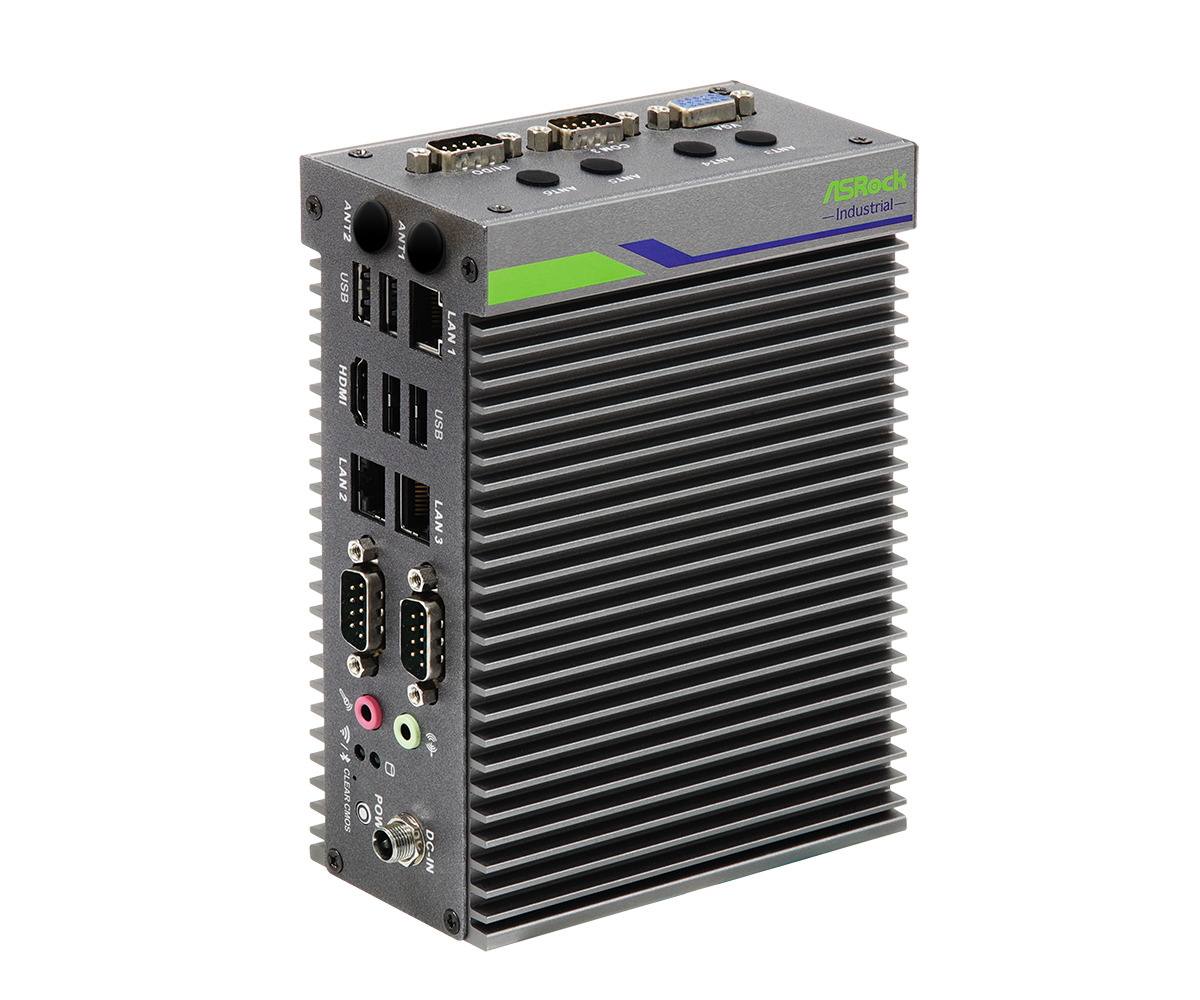
Intel Atom x6425RE Extended Temperature Edge Gateway with 3x GbE and 6-36V Terminal Block
- CPU
- Intel Atom x6425RE (Elkhart Lake)
- Ethernet
- 3× GbE
- Temp
- −40 to +70 °C
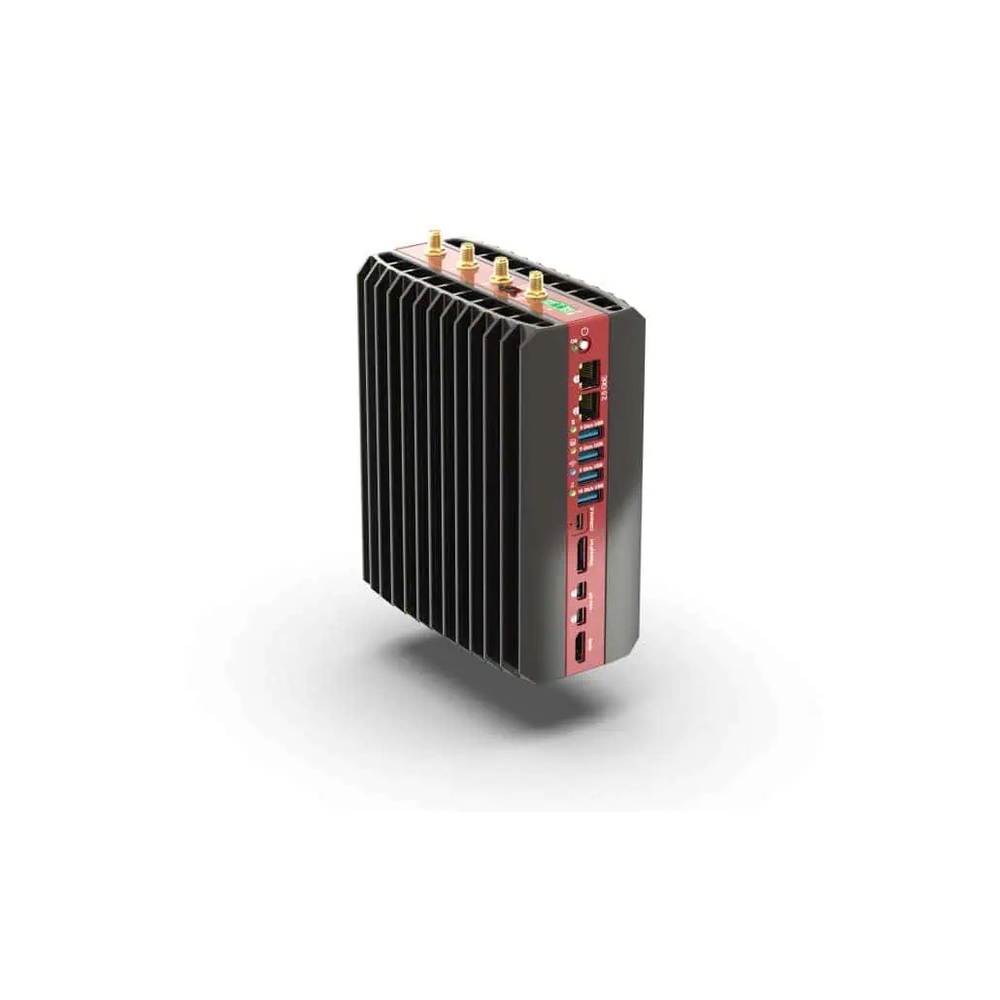
AMD Ryzen Embedded 8845HS DIN Rail Industrial PC with Hailo AI Options and 4x 2.5GbE
- AI
- 16–40 TOPS
- CPU
- AMD Ryzen Embedded 8000
- Ethernet
- 4× 2.5GbE
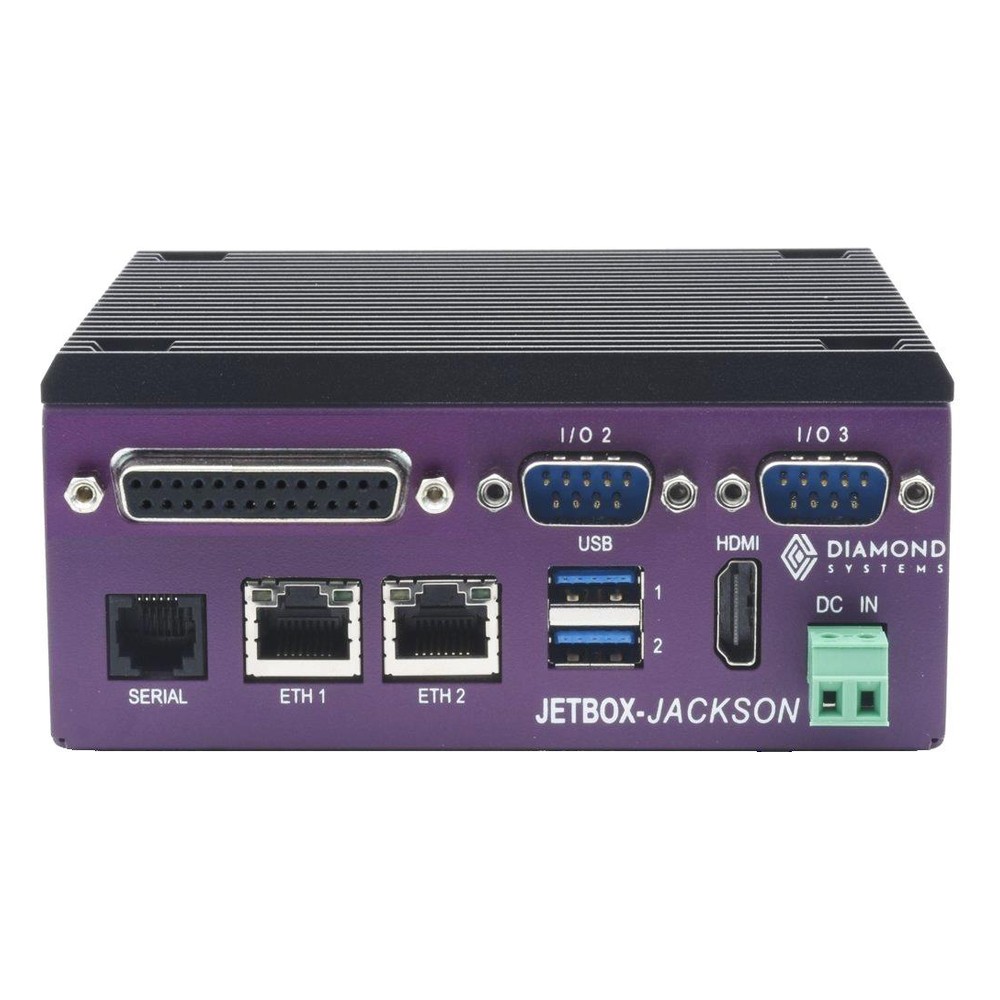
NVIDIA Jetson Orin NX 16GB Fanless DIN Rail PC with Dual GbE, CAN and 1TB NVMe SSD
- AI
- 100 TOPS
- SOM
- NVIDIA Jetson Orin NX 16 GB
- Ethernet
- 2× GbE
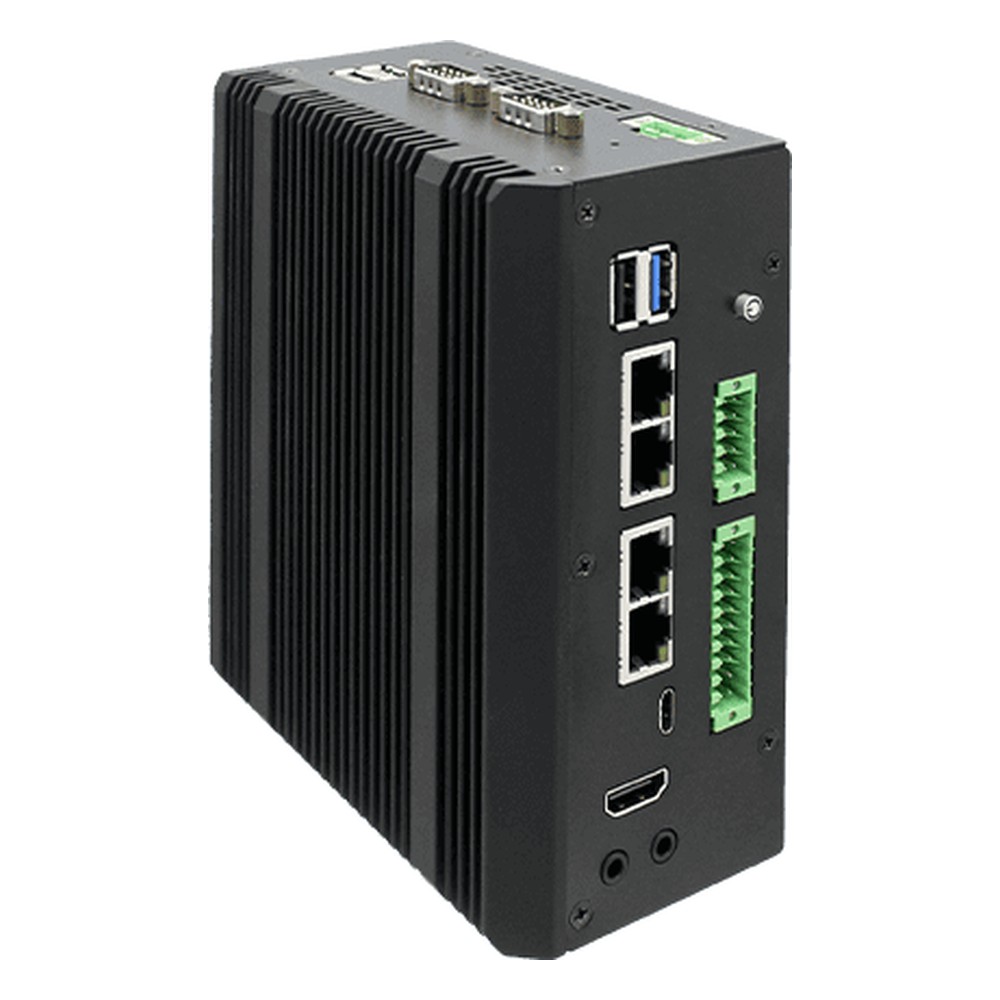
NVIDIA Jetson Orin Nano Edge AI DIN-Rail Box PC with 9 to 36V DC and Wide Temperature
- AI
- 40 TOPS
- SOM
- NVIDIA Jetson Orin Nano 8 GB
- Ethernet
- 4× GbE (1× PoE)
Building the business case
Published savings figures for predictive maintenance vary widely and most come from vendors, so treat any single number with care. One frequently cited source is the US Department of Energy’s Operations and Maintenance Best Practices Guide (Release 3.0), which quotes independent surveys of industrial programs reporting average reductions in maintenance costs of 25–30% and in downtime of 35–45%, with breakdowns reduced by 70–75%. The same guide notes that starting a program takes real investment in equipment and training.
Your own figures matter more than industry averages. Before a pilot, record a baseline for the machines involved: unplanned downtime hours and their cost, maintenance labor and parts, secondary damage, and reliability measures such as MTBF and mean time to repair. Compare the same figures after six to twelve months.
| Cost or benefit | What drives it | How to measure it |
|---|---|---|
| Avoided unplanned downtime | Lost output per hour on the affected line | Downtime hours from the CMMS or production records |
| Avoided secondary damage | A failed bearing that damages a shaft, gearbox or product | Repair cost per failure event |
| Fewer unnecessary jobs | Time-based tasks replaced by condition-based ones | Planned maintenance hours and parts used |
| Sensors and I/O | Number of assets and measurement points | Bill of materials per asset |
| Edge computing and connectivity | Signals per site and model complexity | Hardware, installation and network cost |
| Software and people | Analytics licenses, data science and maintenance time to act on alerts | Annual running cost |
The strongest cases usually come from a few critical assets where a single failure is expensive: a compressor that stops a line, a pump with a long lead time for spares or a gearbox that is hard to reach. Expanding from there, asset by asset, lets each step pay for the next.
Planning an AI predictive maintenance pilot
Six checks that decide whether a pilot produces useful predictions or a dashboard nobody acts on.
-
01
Critical assets
Rank machines by the cost and safety impact of failure and pick three to ten for the pilot.
-
02
Failure modes
List how each one fails, using maintenance records or an FMEA, and choose the signals that reveal those failures early.
-
03
Existing data
Check what the PLC, drives and meters already measure before adding sensors; process context cuts false alarms.
-
04
Edge and network
Size the edge computer for the signal rates and models, and agree with IT how it connects and is updated.
-
05
Response process
Decide who receives an alert, how it becomes a work order and how findings are recorded for retraining.
-
06
Baseline and review
Record downtime and maintenance cost before the pilot and review them after six to twelve months.
AI predictive maintenance: common questions
Quick answers
Is AI predictive maintenance the same as condition monitoring?
No, it builds on it. Condition monitoring measures the machine and raises alarms. AI predictive maintenance uses those measurements, plus process data, to learn normal behavior, detect subtle changes and estimate when a fault will become critical.
Do I need failure data to start?
Not for anomaly detection. Anomaly detection learns from normal operation only. Fault classification and remaining useful life models need labeled failures, which build up as alerts are investigated and recorded.
Should predictive maintenance models run at the edge or in the cloud?
Usually both. Signal processing and real-time anomaly scoring run at the edge, close to the machine. Fleet comparison, long-term storage and model training usually run centrally.
How much computing power does a predictive maintenance model need?
Less than most people expect. Feature-based anomaly models run on a gateway-class processor. Spectral models and multi-channel deep learning benefit from an NPU or GPU, and camera-based inspection needs one.
Can older machines be retrofitted?
Yes, in most cases. Clamp-on current sensors, magnet-mounted or wireless accelerometers and surface temperature sensors need no changes to the machine, and many older PLCs can be read over Modbus.
How long before the predictions can be trusted?
Weeks for a baseline, months for confidence. An anomaly model needs data covering the machine’s normal operating modes, which may include shifts, products and seasons. Remaining useful life estimates need longer histories.
What is remaining useful life?
The time left before a fault reaches a failure threshold. Remaining useful life (RUL) is a prognostic estimate, usually given with an uncertainty range, that lets maintenance be scheduled into a planned stop.
Does predictive maintenance replace preventive maintenance?
No, it complements it. Most sites keep time-based tasks such as lubrication and inspections, and use predictive maintenance on the assets where failures are costly and give early warning.
Predictive maintenance FAQs
-
What Is Predictive Maintenance?
Predictive maintenance uses data from sensors on machines, such as vibration, temperature and current, to predict when a part is likely to fail, so it can be repaired just before it breaks. It avoids both unplanned breakdowns and the wasted cost of replacing parts on a fixed schedule.
-
What Is Condition Monitoring?
Condition monitoring is measuring a machine’s health continuously or at regular intervals, using parameters such as vibration, temperature, oil quality, sound and electrical current, to detect changes that point to a developing fault. It turns breakdowns into planned repairs and is the data foundation that predictive maintenance is built on.
-
What Is Edge AI?
Edge AI means running trained artificial intelligence models on computers close to where data is created, such as beside cameras, machines or vehicles, rather than in the cloud. Decisions happen locally in milliseconds, less data crosses the network, sensitive data stays on site, and the system keeps working if the connection drops.
-
What Is an IIoT Gateway?
An IIoT (Industrial Internet of Things) gateway is a rugged edge computer that connects industrial equipment, such as PLCs, sensors, meters and machines, to a network or the cloud. It collects their data, translates between industrial and IT protocols, processes and secures it at the edge, and forwards the results.
-
What Is a Digital Twin?
A digital twin is a virtual model of a physical asset, system or place that is kept up to date with real data from sensors, cameras and scans. Engineers use it to see the current condition of the real thing, spot changes over time, and test decisions on the model before acting on the asset itself.
-
What Is Modbus?
Modbus is an open communication protocol that lets industrial devices such as PLCs, sensors, meters, drives and HMIs exchange data. First published by Modicon in 1979, it uses a simple request and response model: one device asks for or writes values, and another replies. It runs over serial lines as Modbus RTU and over Ethernet as Modbus TCP.
-
How Is AI Used in Manufacturing?
AI in manufacturing means using machine learning models on factory data to inspect products, predict machine failures, guide robots, improve processes and keep people safe. Most of it runs on edge computers beside the line, where cameras and sensors produce the data and decisions are needed in milliseconds. Planning and forecasting models usually run in the cloud.
Planning a predictive maintenance pilot?
Tell us which machines you want to monitor, the signals and controllers already in place and where the computer will be mounted. We will recommend the I/O, gateway and edge AI hardware, then configure, image and test it before it ships.